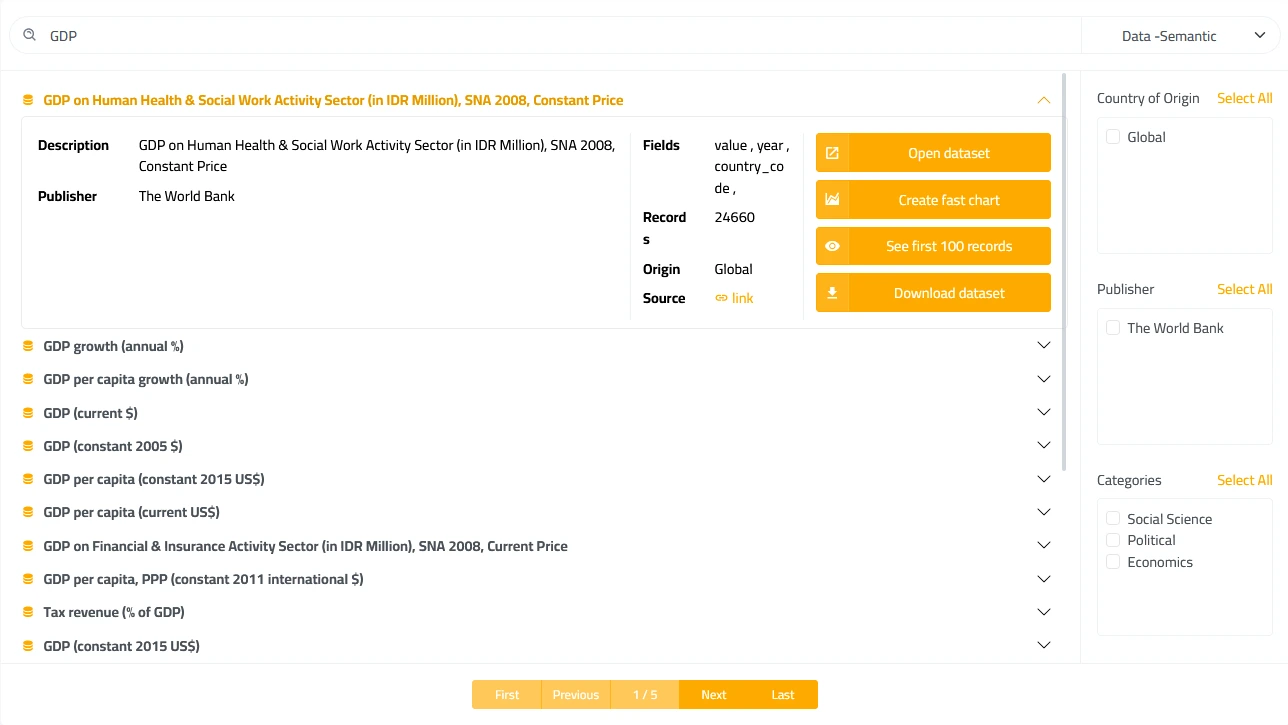
Dataset Explorer
- Search across diverse datasets covering multiple subjects from trusted sources worldwide.
- Filter datasets by country of origin, publishers, and categories to find exactly what you need.
- View detailed information about each dataset and preview sample records before downloading.
- Filter datasets further by columns and search through individual dataset records.
- Download full datasets, partial sections, or create custom charts directly from the data.

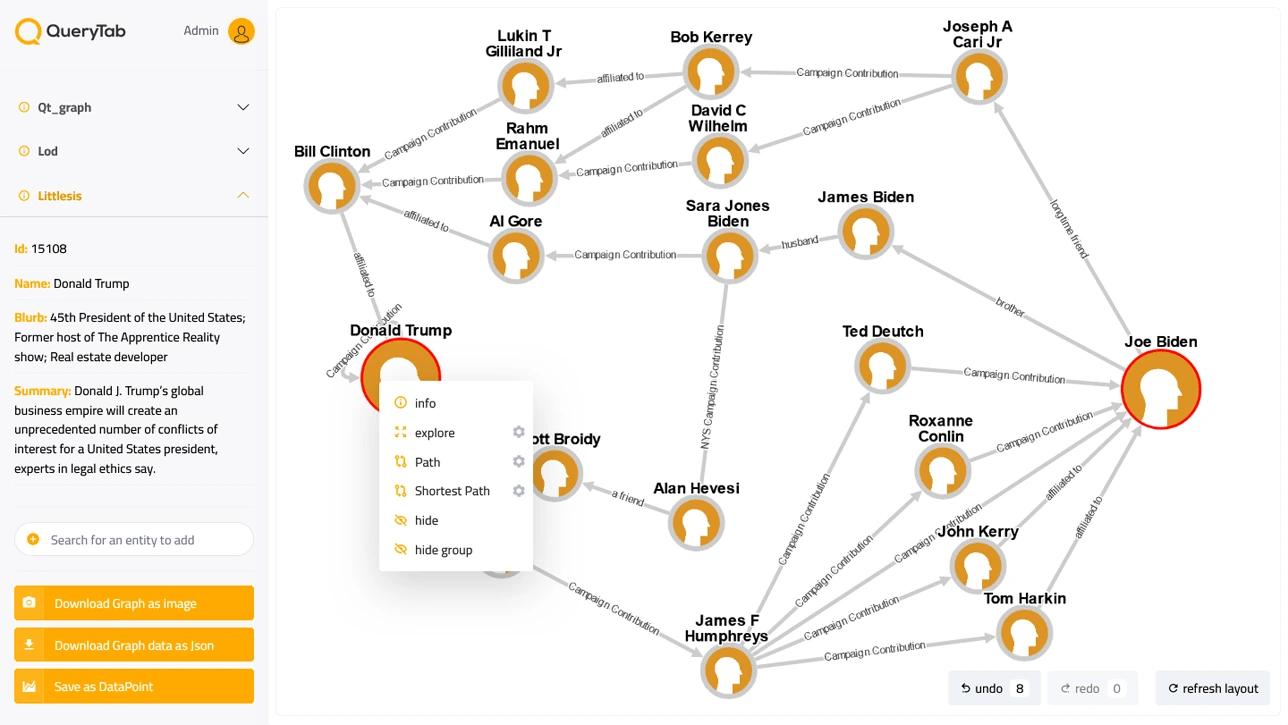
Graph Explorer
- Search for entities and explore them as interactive nodes with comprehensive information from open sources.
- Discover direct relationships by exploring entity connections and finding paths between multiple entities.
- Use advanced graph editing features including hide/show data, undo/redo actions during exploration.
- Download your generated graphs as high-quality images or export underlying data as JSON files.
- Convert any graph exploration into reusable data points for sharing, articles, or website embedding.
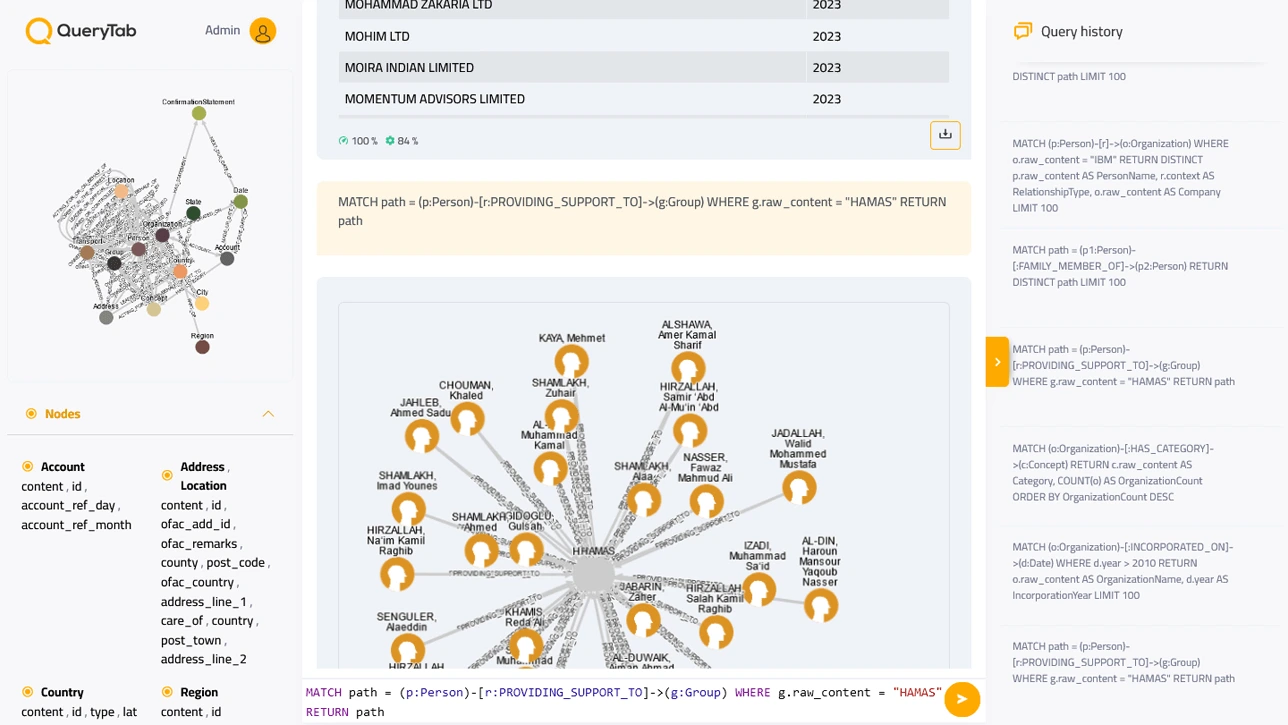
Advanced Querying
- Query data directly using Neo4j's native Cypher language with full syntax support and natural language assistance.
- Access comprehensive schema information, node details, and relationship helpers to craft accurate queries.
- Get real-time query performance feedback and optimization suggestions for efficient data retrieval.
- View results as interactive graphs for visual data or structured tables for tabular information.
- Automatically save every query result as a data point in your account for future reference and reuse.
Datapoints Dashboard
- Organize all your data points from advanced queries, graph explorations, and shared public sources.
- Arrange data points in customizable folders with powerful search capabilities across your collection.
- Merge multiple data points together, combining graphs or joining tables from different sources seamlessly.
- Copy and integrate publicly shared data points into your personal dashboard for collaborative analysis.
- Advanced management tools for bulk operations, reorganization, and efficient data point categorization.
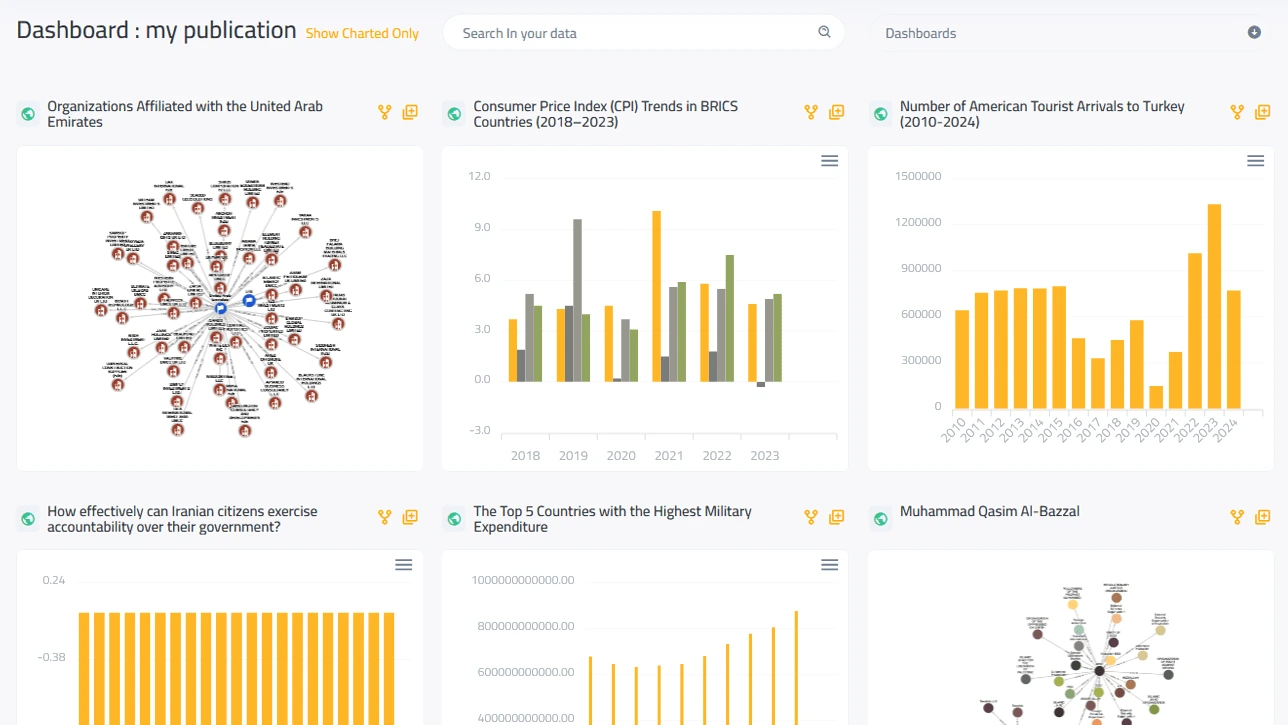
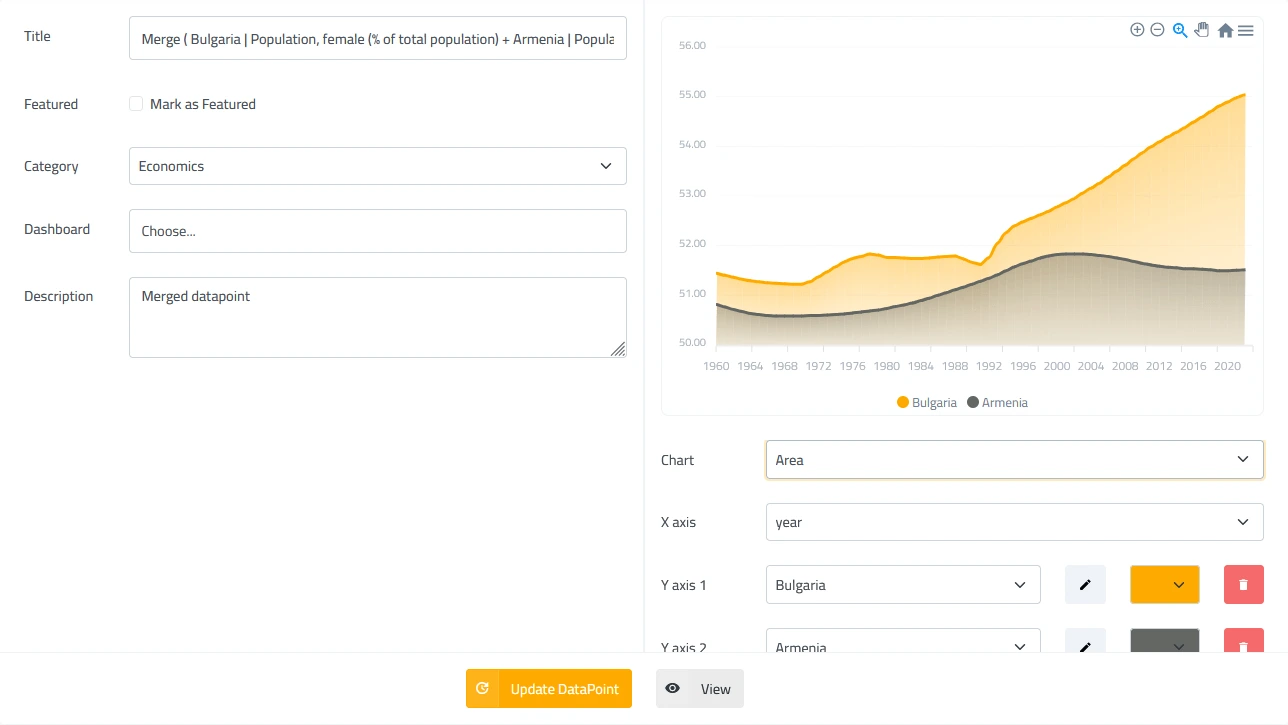
Chart Builder
- Access after dataset exploration or advanced querying to create charts from tabular data points.
- Choose from multiple chart types: bar, line, area, pie, donut, radial, scatter, heatmap, and radar charts.
- Dynamically configure X-axis, Y-axis, and multiple Y-axes with custom color schemes for each data series.
- Customize chart elements including titles, labels, and data series names for clear, professional visualizations.
- Export charts as high-quality images or generate interactive HTML embeds for websites and presentations.
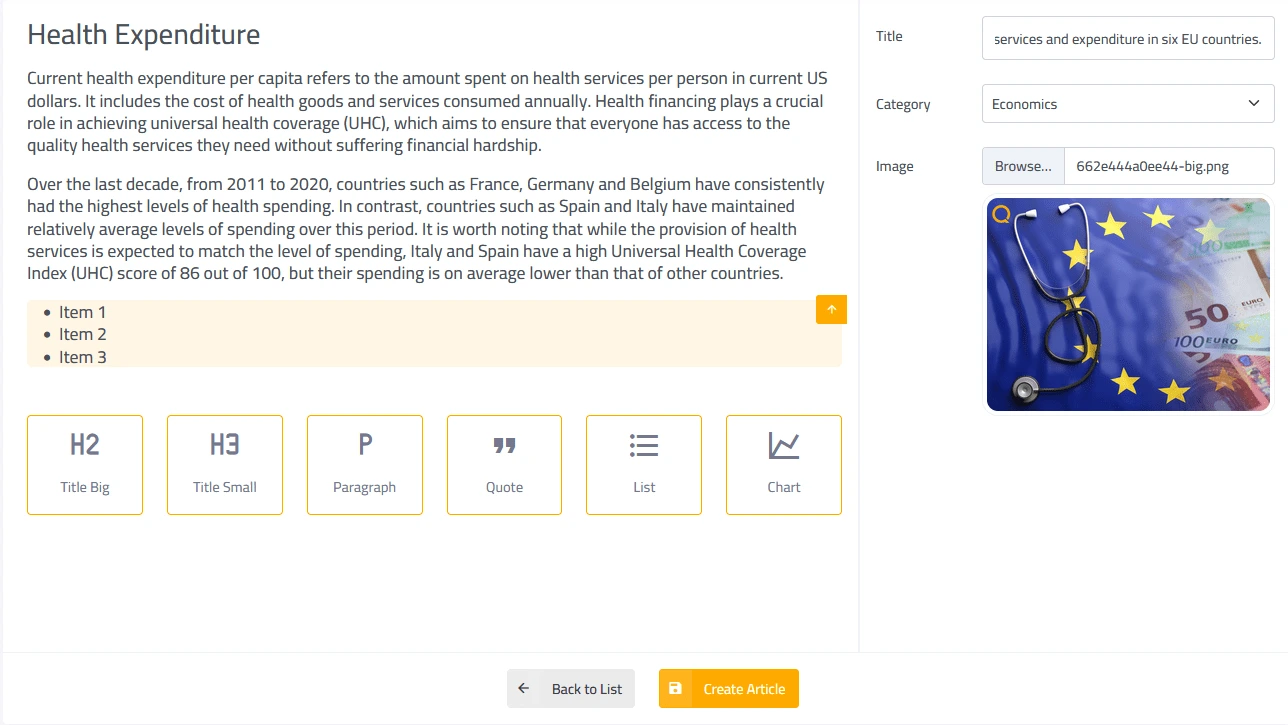
Article Builder
- Create professional articles using an intuitive builder with image selection, tagging, and keyword management.
- Build articles with standardized blocks including titles, paragraphs, quotations, lists, and embedded charts.
- Focus on content creation while the system handles alignment, design, and consistent formatting automatically.
- Embed data visualizations, charts, and data points directly from any part of the system into your articles.
- Publish articles for review and approval, making quality content publicly available across the platform.